Ice595: 3 x P-drop f.g. ice I + 3% by vol 1-micron Al2O3
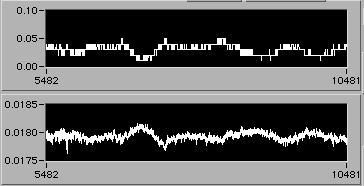
| Legend: top graph of each pair is motor speed V (i.e., edot), bottom is load. Top graph is the one to pay attention to. Translate V to edot thus: for 100:1 gearing V0.05 ≈ 3e-8/s; for 10:1 gearing V0.05 ≈ 3e-7/s. Horizontal scale is time. 5000 pts ≈ 14 hrs. |
|
|
.png) |
e=0.173 |
0900 hrs 2/24, last part of (5). No strain rate evolution over 2.5%. Good enough. Time to make the poster. |
.png) |
e=0.166 |
2200 hrs 2/23, (5) continues. Flat. |
.png) |
e=0.159 |
0845 hrs 2/23, (5) continues. Looks pretty steady, would like to be positive. |
.png) |
e=0.152 |
2130 hrs 2/22. Start of step (5). |
.png) |
e=0.105
0.149 |
0615 hrs 2/22, last part of (4b). Fair enough; no detectable change in edot in last >36 hrs. Doesn't prove that microstructure has stopped evolving, but is consistent therewith.
Data for the LPSC poster probably have to stop here; however, the run can continue. Start warming to 220 K.
Error: results to date based on L0=2.690" vs actual 1.894"; corrected values of e now appended. All this work hardening has simply been stress falling. Simpler result, but didn't have to spend so many days on step (4). |
.png) |
e=0.099
0.141 |
1915 hrs 2/21, (4b) continues. |
.png) |
e=0.093
0.133 |
0700 hrs 2/21, first part of step (4b). |
.png) |
e=0.086
0.123 |
1600 hrs 2/21, last part of (4a). Still been a slight downward drift of edot; even though it is insignificant as far as the location of a point on a log edot - log stress plot goes, it might be important for understanding the mechanism to establish if microstructure--grain size and the location of the dust grains in particular--is still evolving. So: executive decision to continue at this s and T. |
.png) |
e=0.080
0.114 |
0630 hrs 2/20, step (4a) continues. Not that much change in edot over past 24 hrs and 2% strain. |
.png) |
e=0.072
0.102 |
1830 hrs 2/19, step (4a) continues. |
.png) |
e=0.063
0.090 |
0600 hrs 2/19, first part of step (4a), now well below where step (2) left off. Investigating work hardening... |
.png) |
e=0.0533
0.0758 |
1650 hrs 2/18, step (4) just underway. Same conditions as step (2). Far too soon to say it's behaving the same now, but step (2) did level out at just under V0.40. |
.png) |
e=0.0516
0.0733 |
1515 hrs 2/18, last part of step (3). udot has been flat for 48 hrs. |
.png) |
e=0.0511
0.0726 |
1000 hrs 2/18, step (3) continues. No measurable change in edot since step started 36 hrs ago. So why keep going? Total strain so far this step is 0.0025; just trying to make it sound more defensible. |
 |
e=0.0503
0.0715 |
2050 hrs 2/18, step (3) continues |
.png) |
e=0.0494
0.0702 |
0545 hrs 2/17, first part of step (3), started at 1600 hrs yesterday, back at conditions of step (1). That step ended at udot ~V0.06; here it is showing ~V0.03. Factor of 2 change matches the w.h. change during step (2)., so n=4 now looks appropriate once again. |
 |
.png) |
e=0.0485
0.0697 |
1600 hrs 2/16, last part of step (2). Still a slight amount of work hardening, but time to move on. We may come back. |
.png) |
e=0.040
0.057 |
0615 hrs 2/16, step (2) continues, and so does work hardening. udot ratio wrt step (1) is has fallen by 2x to ~0.40/0.06, meaning apparent n < 3. This doesn't alter the general scheme of a plot, but does underscore the complexity. |
 |
.png) |
e=0.028
0.040 |
1830 hrs 2/15, step (2) continues. Lookee here, some fairly significant work hardening |
.png) |
e=0.0193
0.0274 |

|
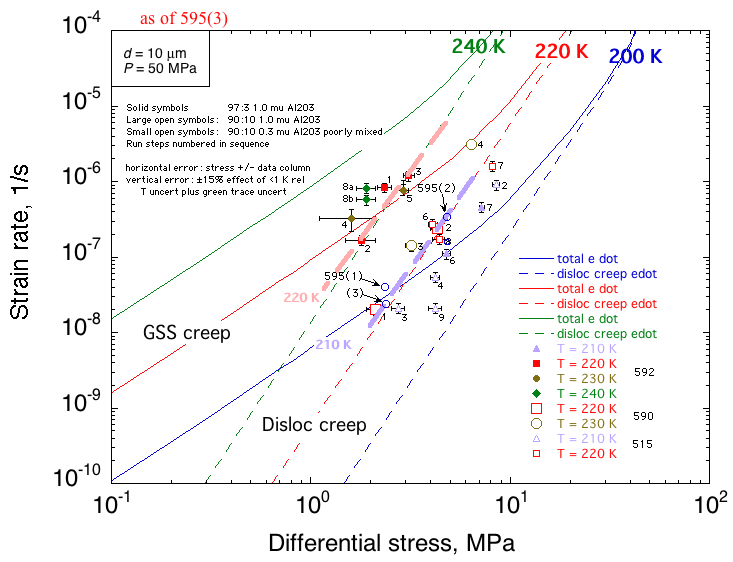
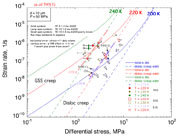
1140 hrs 2/15, start of step (2). Stress is 2x faster. udot, just looking at the charts to the left is ~0.80/0.06 = 15x faster, meaning n≈4. Very consistent behavior these last two runs. Strength is low, but n is high. Those fat lines we drew on the LPSC abstract Fig. 3 say the same thing; the main refinement here is that those lines shift significantly to the left (click above). Strength is so low that it approaches (falls below?!?) that of pure ice GSS creep.
Work hardening here is very non-GSS creep like. We have got something seriously interesting going on here.
Steps (1) and (2) here also give solid evidence that 210 K points in run 592 suffered from grain growth, which must have happened at 230 K. |
.png) |
e=0.0145 |
0840 hrs 2/15, end of (1d). No zero drift to worry about. |
.png) |
e=0.0129
0.0206 |
2050 hrs 2/14, first part of step (1d). Will teminate this step tomorrow morning after 4 days of deformation, to a strain of ~1.5%. |
.png) |
e=0.0115
0.0163 |
0845 hrs 2/14, last part of (1c). No drift in s gage zero this time. So this step is good and solid: steady stress, steady strain rate. |
.png) |
e=0.0106
0.0150 |
2340 hrs 2/13, mid (1c). Very steady all around. |
.png) |
e=0.0094
0.0133 |
1550 hrs 2/13, first part of step (1c), s setpt set back to 2.4 MPa. |
.png) |
e=0.0084
0.0119 |
0610 hrs 2/13, completion of (1b). Some zero drift of force gage again, this amounting to about 10% of load, meaning s≈2.7 MPa at end of run. |
.png) |
e=0.0064
0.0091 |
2130 hrs 2/12, first part of step (1b). s is now set to 2.4 MPa, same as at end of (1a). It can't drift; I took every precaution. edot so far same as (1a). Visible in udot chart is seemless replacement of 10:1 gear reduction with 100:1 at pt. ~800. |
.png) |
e=0.0039
0.0055 |
0700 hrs 2/12, end of step (1a). s and edot tracing beautifully steady-state, but it was not to be: I was most disappointed to discover upon unloading that the problem of zero drift was back. So this step began at 1.4 MPa and ended at 2.4 MPa. Still light years away from GSI creep. |
.png) |
e=0.0010
0.0014 |
1700 hrs 2/11. Just started step (1a) so far so good. The current displacement rate is roughly twice that for GSS creep in D etal (2001) Fig. 2. The first step of 592 also started fast; it could well be that there is a slight non-parallelism of contacting faces of piston and sample. So I expect this will slow down for a day or two.
Current rate is ~100x faster than GSI creep... |